- शिक्षा
- तकनीकी विश्लेषण
- बोलिंजर बैंड्स
Bollinger Bands
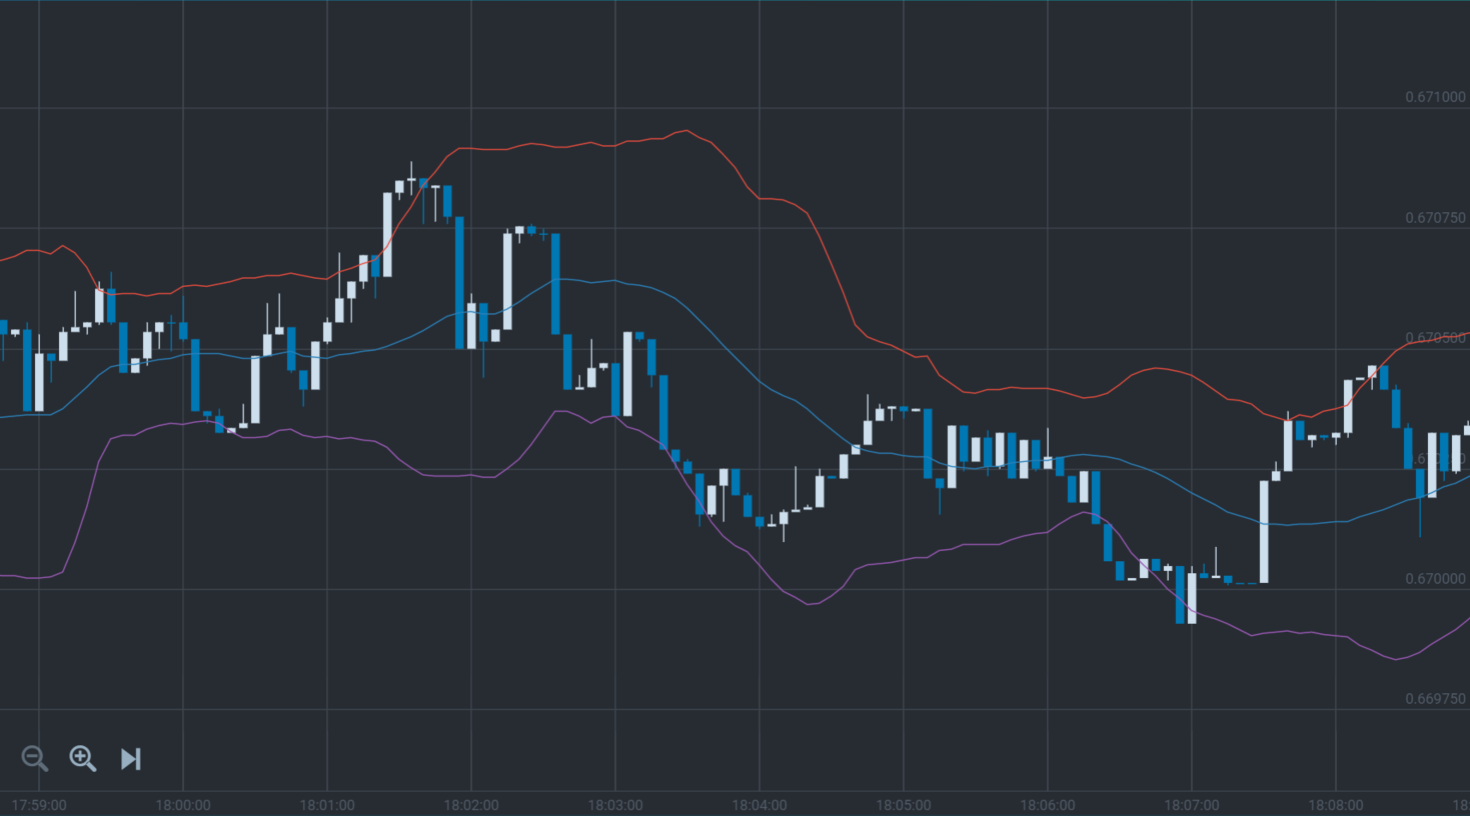
A Bollinger Band is a chart indicator composed of a central line and two other lines laid on both sides of a price chart. The price spends about 95% of its time between these lines. The upper and lower lines of the Bollinger Band serve as the support and resistance lines for the price chart. The indicator is simple and based on the moving average principle. You can see an example as follows:
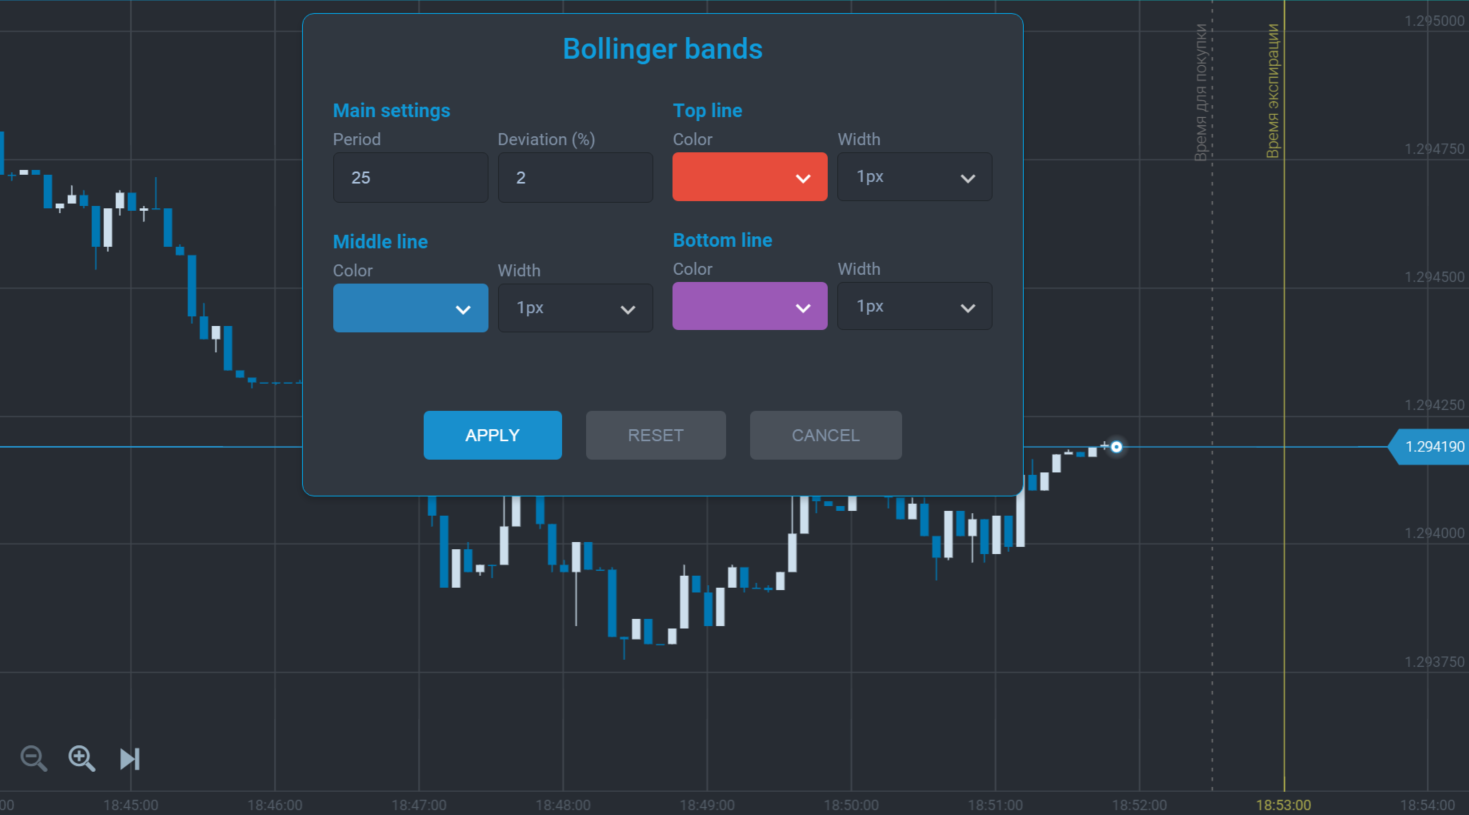
The indicator settings are as shown in the picture:
The red and violet lines represent the resistance and support levels, and the blue line is central. As you can see, there are moments when the price crosses the upper and lower lines, and this period takes only 5% of the price movement. The width of the band equals the root-mean-square deviation of the moving average for a specified period. The price crosses the edges of the band due to abnormal sharp deviations, and when such deviations occur, the price tends to return inside the band. You can earn on such deviations by buying or selling, depending on which edge has been crossed.
Let's investigate Bollinger Bands in detail. The Bollinger Band's width adjusts automatically to the market. When the band becomes narrow, the price movement is weak, and the market is undetermined. The undetermined market is characterized by a narrow flat. The longer this period and the narrower the neck, the stronger the price movement will be afterward. The extension of the band indicates that the market has become unstable and can start to move in any direction. If the band begins to extend after narrowing, you should prepare to receive a trading cue, as the price will start moving. So, what will be the cue to buy or sell? As we discussed before, it's a sharp breakout of the Bollinger Band:
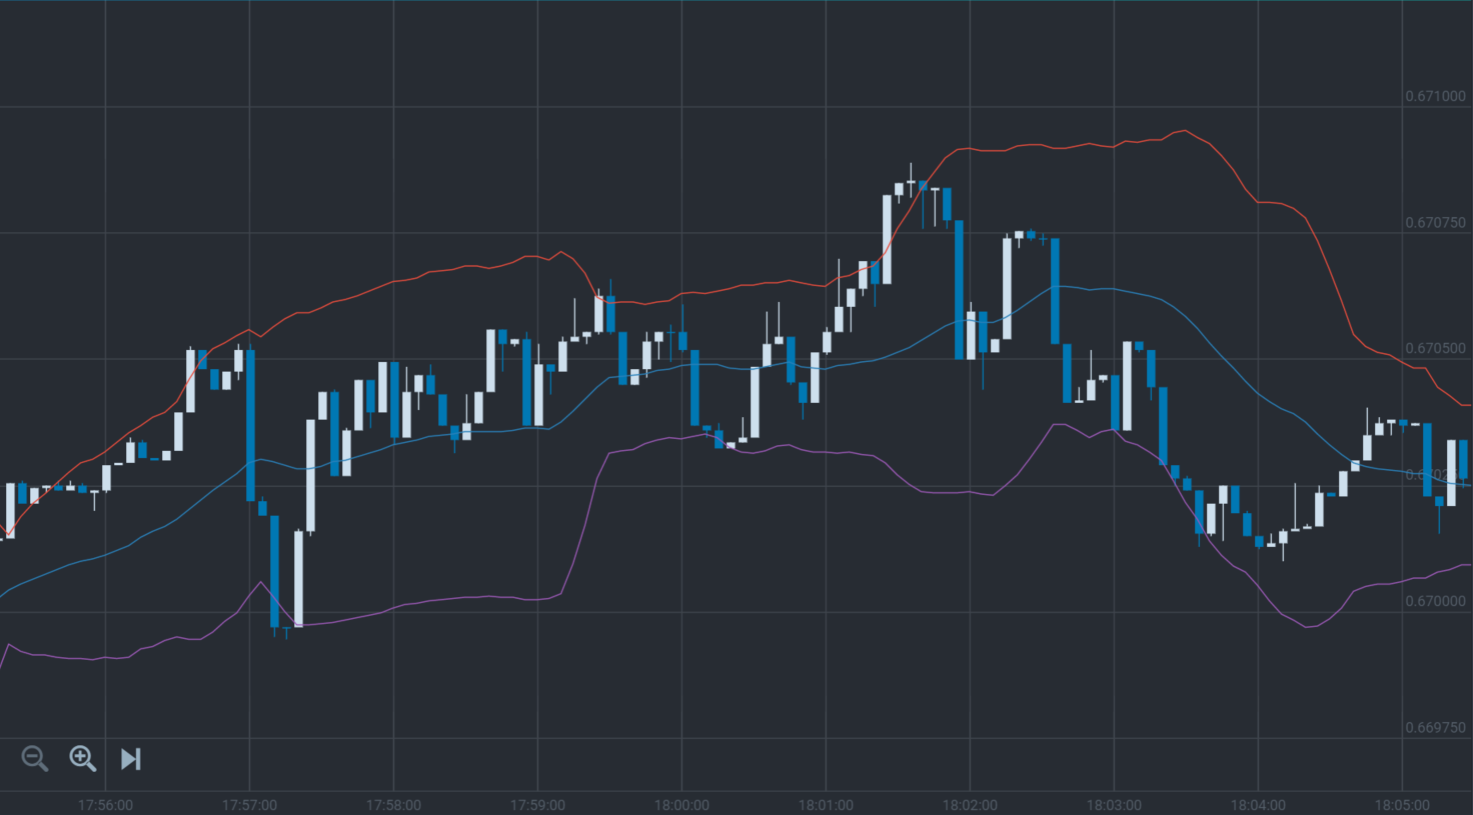
As you can see in the picture, the price sharply penetrated the upper line and was outside for a definite period and then suddenly returned to the central line.
So the indicator is simple to use, but you need to wait for the trading cues. There is another opportunity to use the indicator cues on the wide flat.
As we discussed, the edge lines are strong levels for the price chart. We understand that when the price reaches the edge line without any sharp movements, it will try to return to the central line. At this moment, you can trade. But before that, you should receive a confirmation —it'll be the candlestick following the other one that reached the Bollinger Band. If its direction is opposite, you can open a deal toward the central line. You can see an example of this cue in the image:
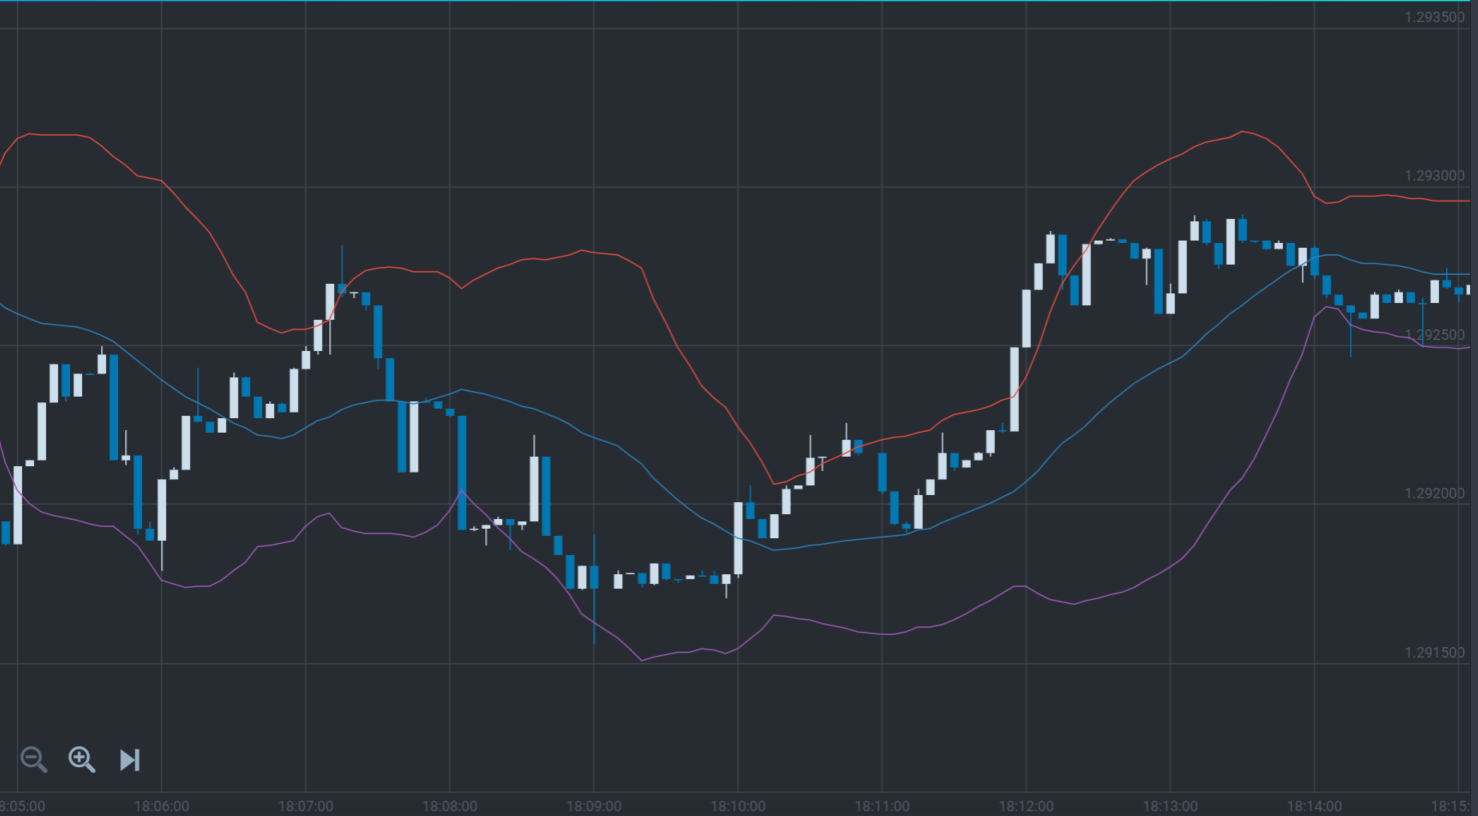
As we see in the picture, if the falling candlestick reaches the Bollinger lower band and the following candlestick moves upward, we make buy calls. And if the growing candlestick reaches the Bollinger upper band and the following candlestick moves downward, we make sell calls.
Whatever the situation in the market may be, the Bollinger Band indicator works and lets us earn. When you become more experienced using this indicator, you will interpret the trading cues more easily and effectively.